Which statistics to track in your trading journal
Win rate, expectancy, risk/reward ratio, drawdown: what each metric really says about your trading, and which one to watch first.
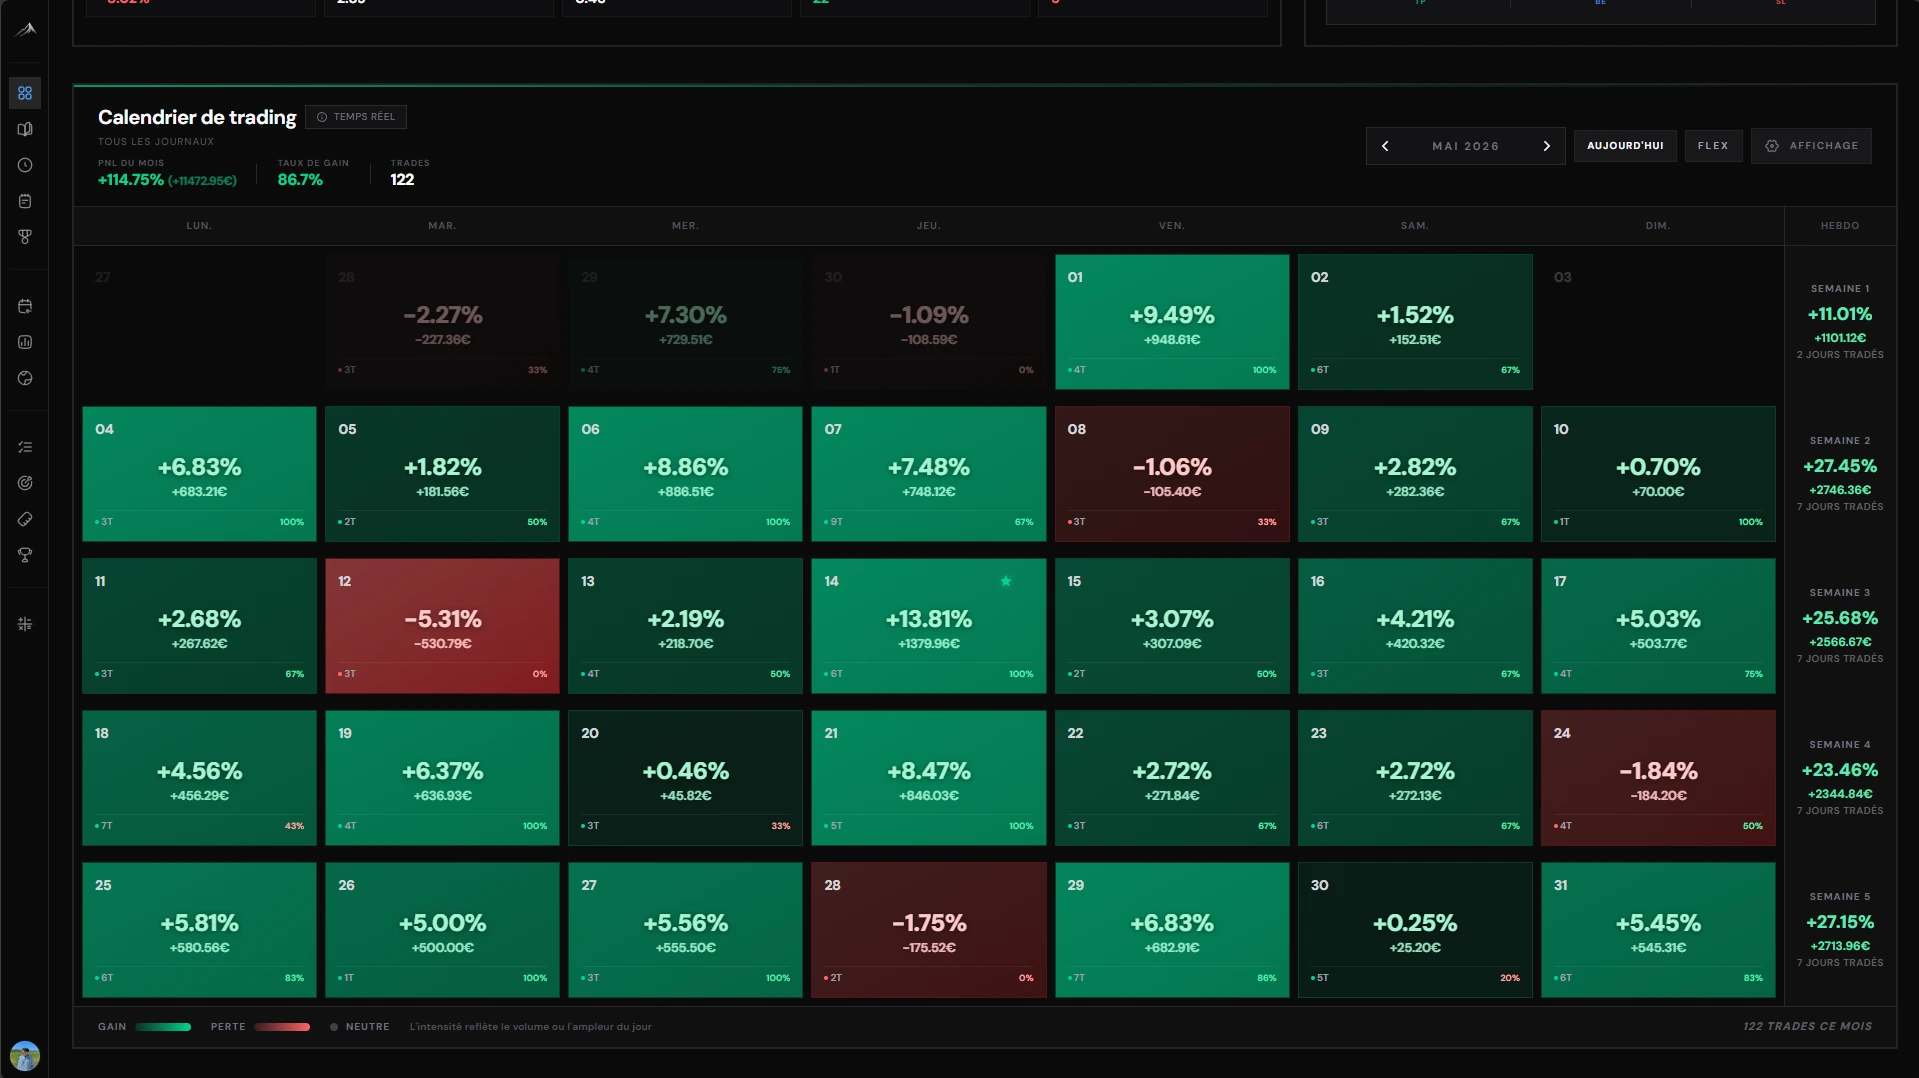
A journal generates a lot of numbers. Four are enough to steer your progress.
Win rate: necessary but misleading
The percentage of winning trades is the first metric everyone looks at — and the most misread. A 40% win rate can be comfortably profitable if your winners return three times what your losers give back. Conversely, a 70% hit rate can ruin an account if the rare losses are enormous.
Risk/reward ratio (R:R)
This is what you win on average relative to what you risk. An R:R of 2 means your average gains are worth twice your average losses. Paired with win rate, it determines whether your system is viable at all.
Expectancy: the real arbiter
Expectancy is your average gain per trade, expressed in R. The formula is simple:
Expectancy = (win rate × average win) − (loss rate × average loss)
A positive expectancy means that, statistically, every trade pays you. It is the one metric that summarises the profitability of your approach on its own.
Drawdown: your tolerance for risk
Drawdown is the largest fall in your capital from a peak. It measures the pain your system puts you through. A drawdown you cannot stomach psychologically will make you abandon an otherwise profitable system — a subject we cover in why I break my trading discipline.
Computing them without effort
Calculating these metrics by hand is tedious and error-prone. Altiora computes them automatically from your imported trades and displays them on a clear dashboard. To understand the whole picture, go back to the complete trading journal guide, or try the platform for free.
About the author
L’équipe Altiora
Altiora editorial team
Altiora's editorial team brings together active traders and the product team. We write about discipline, journaling and performance analysis, grounded in how the platform actually works. We never give investment advice.
Read next
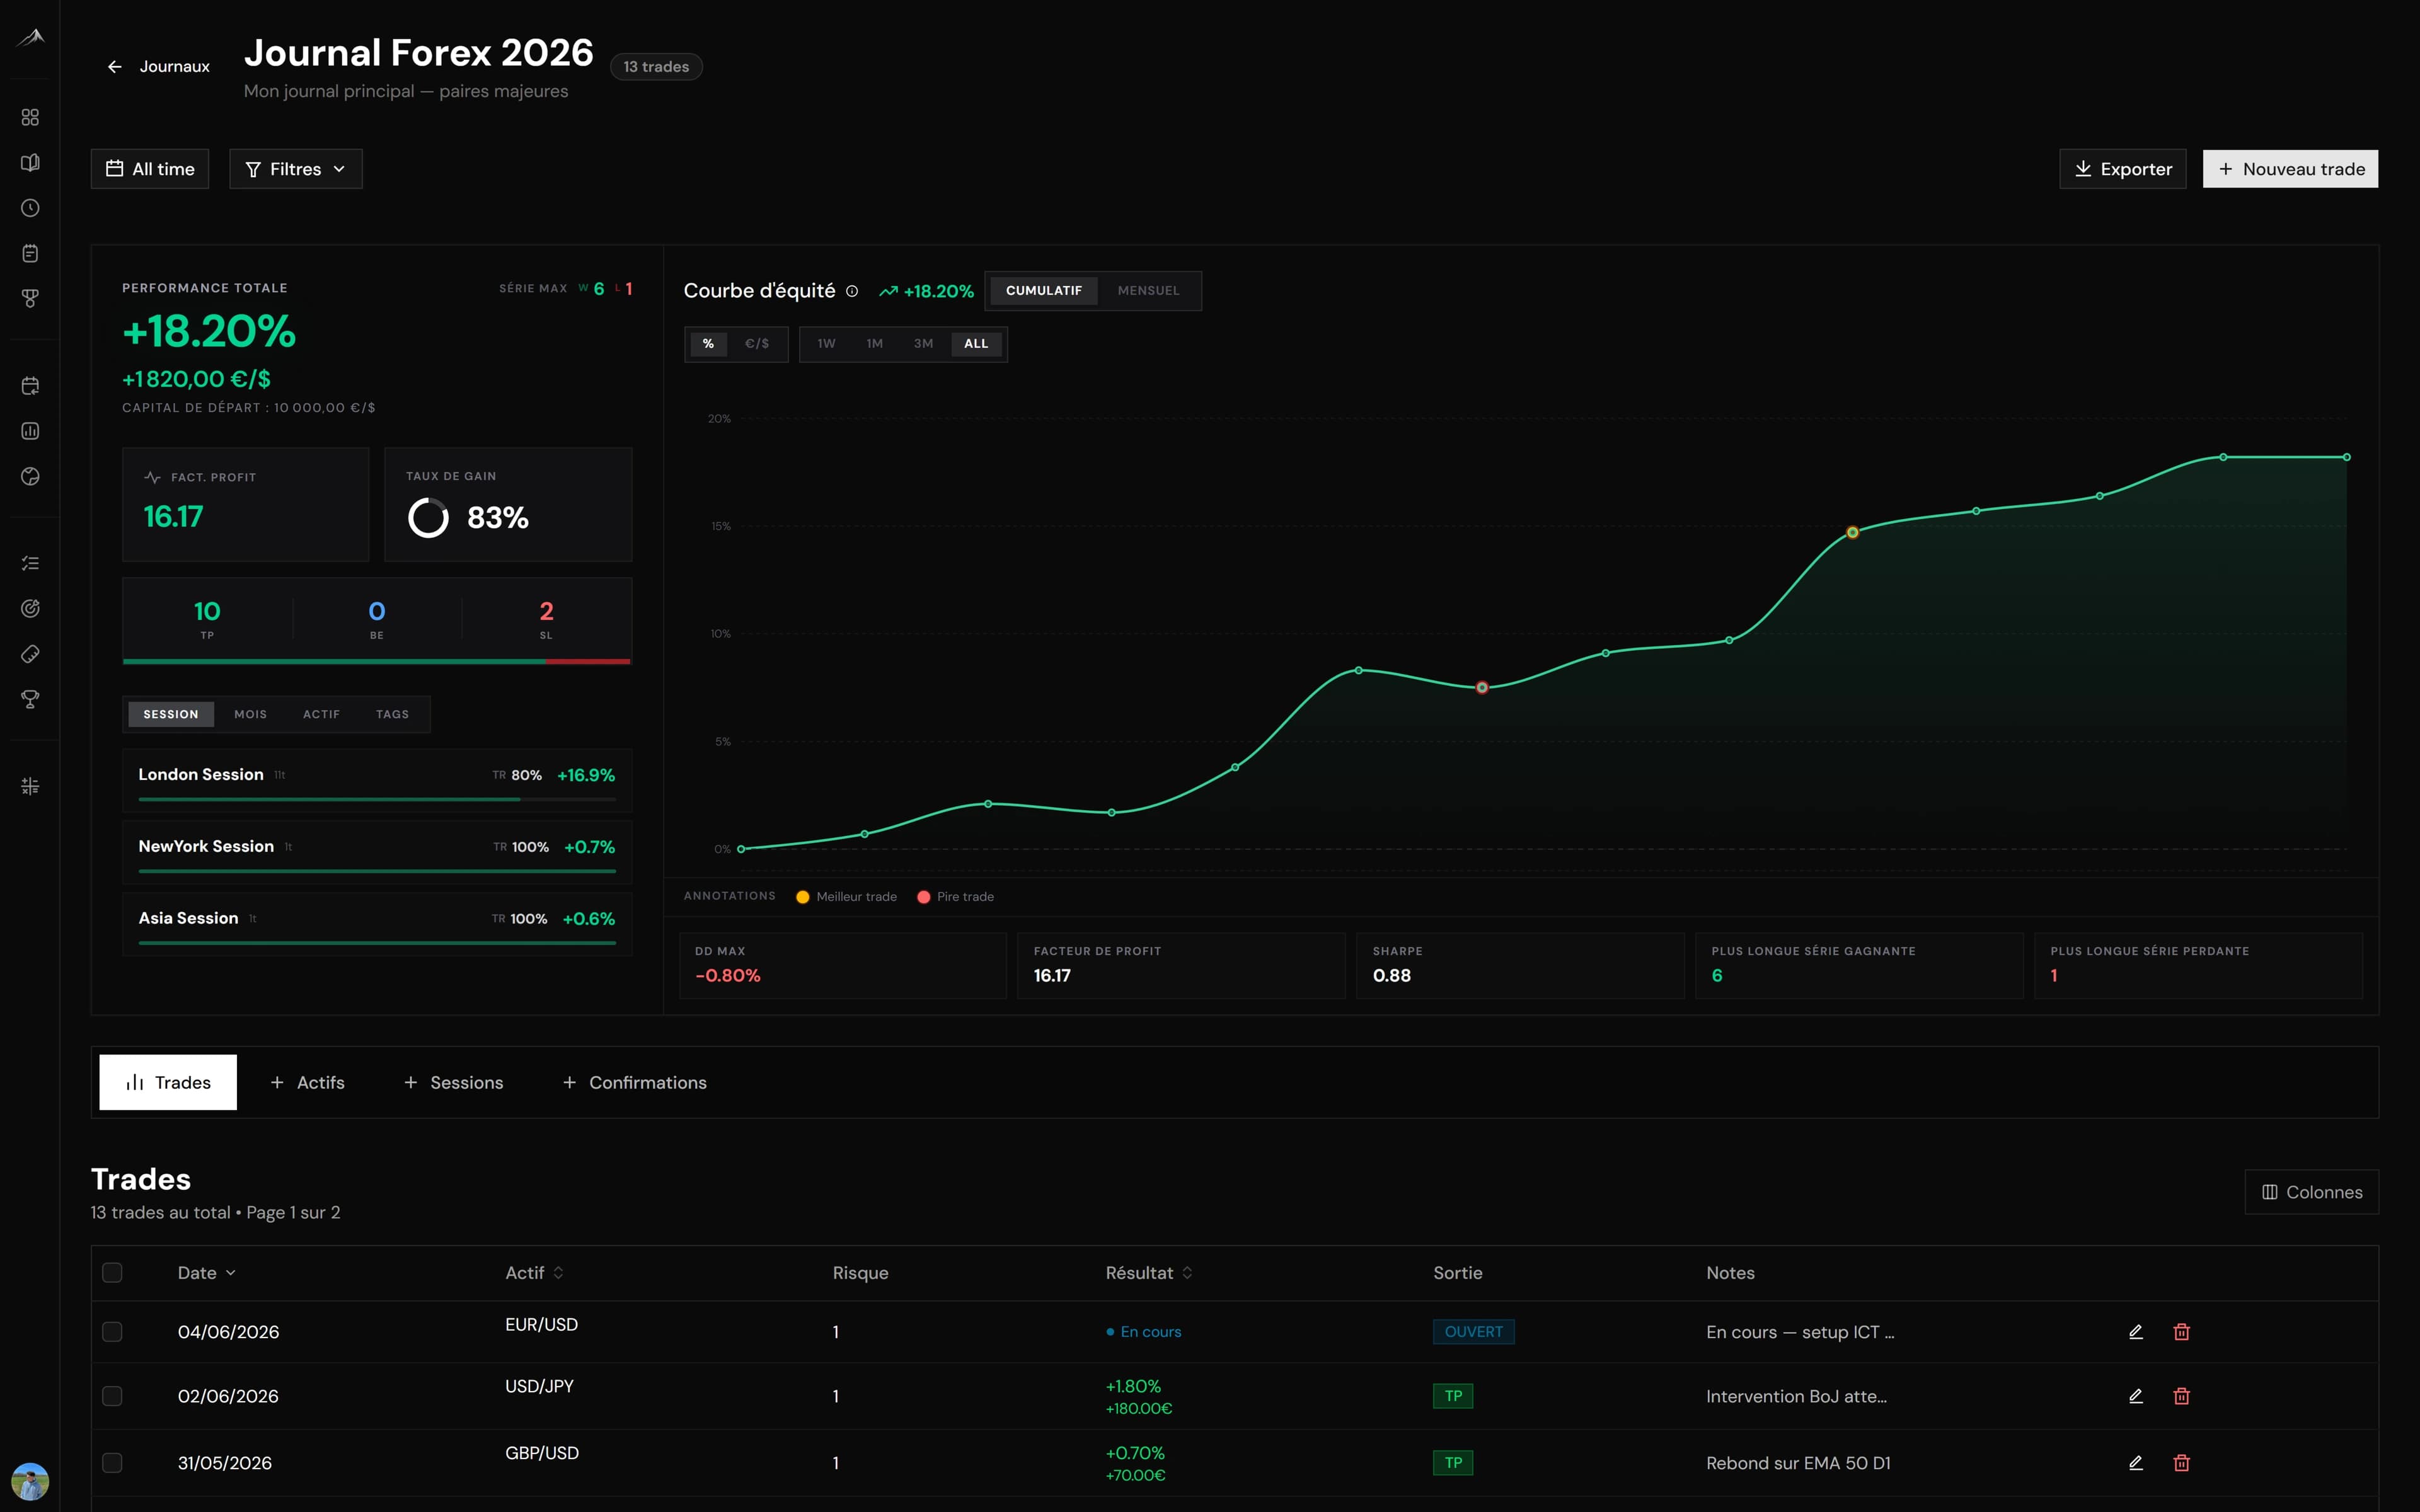
Trading journal: the complete guide to getting better
Why keeping a trading journal changes everything, what to record, which statistics to track, and how to move from a manual notebook to automated tracking that actually compounds.
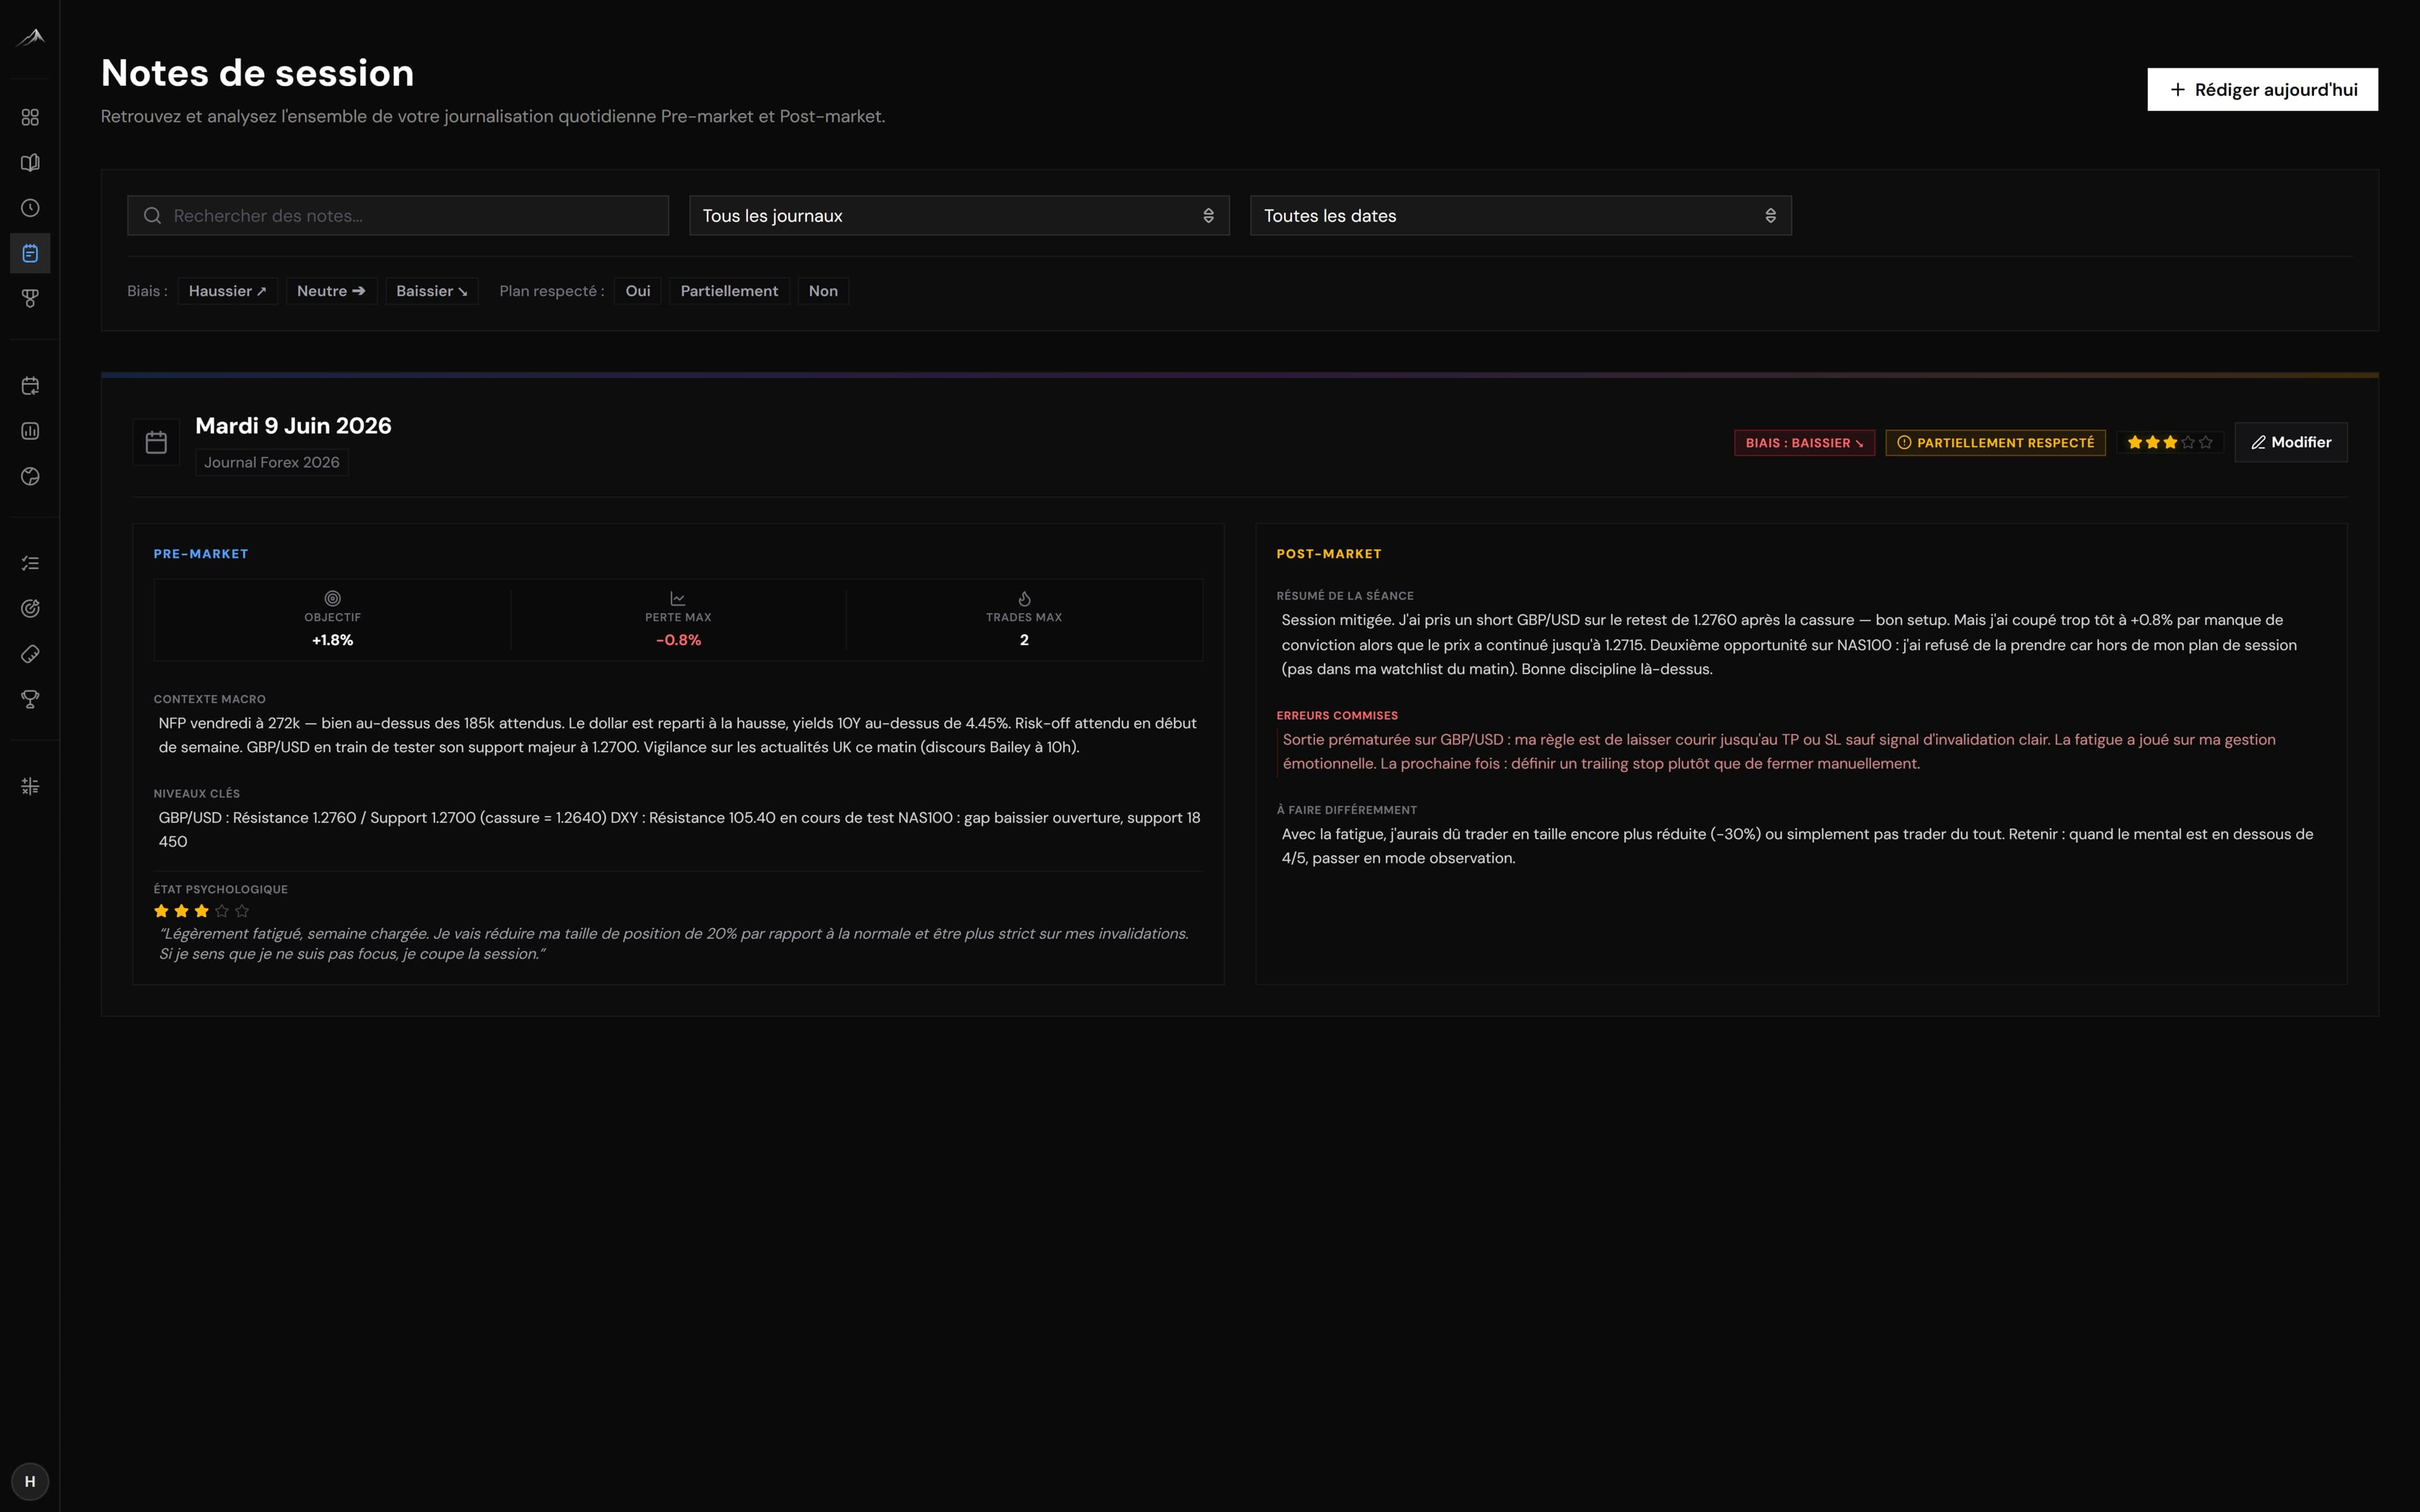
How to keep an effective trading journal (beginner guide)
The step-by-step method for a trading journal you will not drop: what to record, when to fill it in, and how to review it so it actually makes you better.
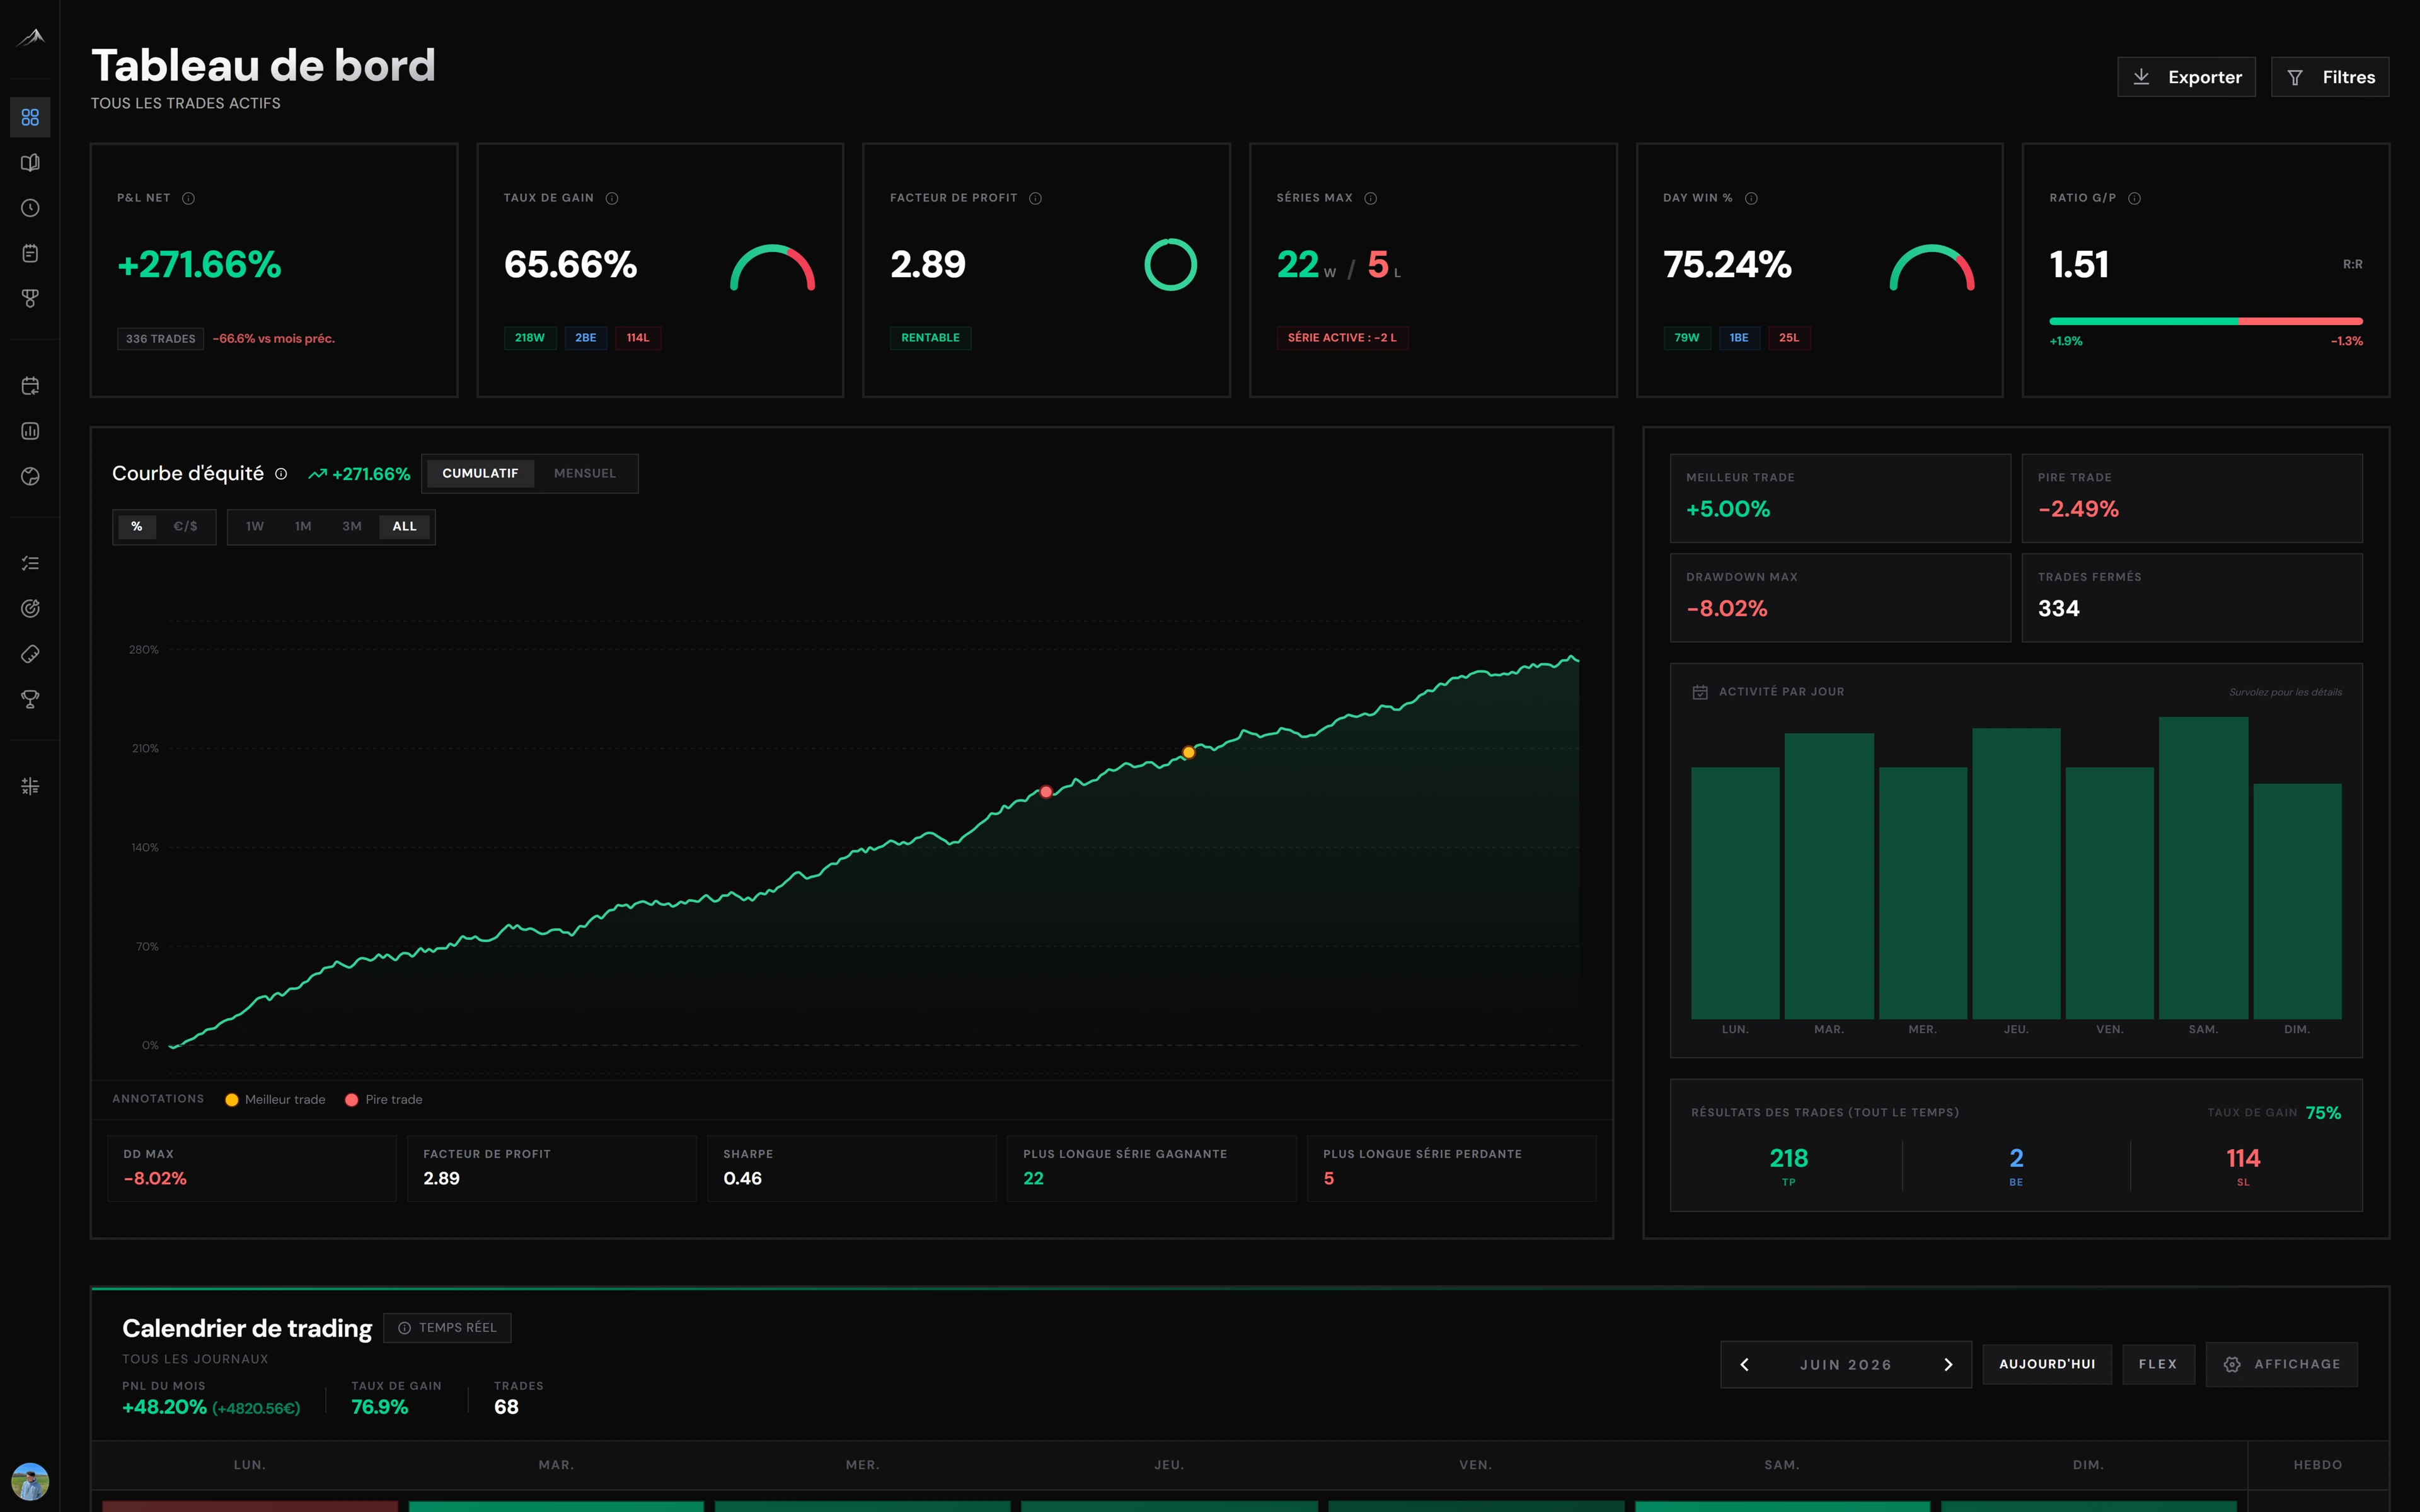
Automated vs manual trading journal: which should you choose?
Notebook, spreadsheet or automated journal: the strengths, the limits and the hidden cost of each approach, so you can choose with your eyes open.